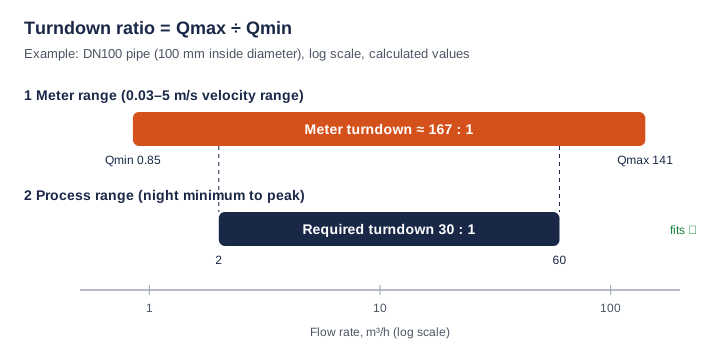
Turndown ratio (also called rangeability) tells you how far below its maximum a flow meter can still measure. Divide the maximum flow rate by the minimum flow rate: a meter that covers 0.85 to 141 m³/h has a turndown of about 167:1. Before choosing a meter, calculate your process turndown (peak flow ÷ lowest flow you need to see) and check that it fits inside the meter's range on your pipe size.
How do you calculate the turndown ratio of a flow meter?
Divide the maximum measurable flow rate by the minimum measurable flow rate and write the result as a ratio, for example 100:1. Because volumetric flow in a full pipe is velocity times cross-sectional area, the ratio is the same whether you use flow rate or velocity, as long as the pipe size does not change.
Turndown = Qmax ÷ Qmin = vmax ÷ vmin
Q = v × A, with A = π × D² ÷ 4 (D = pipe inside diameter)
Worked example: a DN100 cooling-water line
The numbers below are calculated values for a pipe with a 100 mm inside diameter (the real inside diameter depends on the pipe standard and wall thickness) and a meter with a published velocity range of 0.03–5 m/s, such as the SEGMENsensor U10 series.
| Step | Calculation | Result (calculated) |
|---|---|---|
| 1. Pipe area | A = π × 0.100² ÷ 4 | 0.007854 m² |
| 2. Minimum flow | 0.03 m/s × 0.007854 m² × 3600 s/h | 0.85 m³/h |
| 3. Maximum flow | 5 m/s × 0.007854 m² × 3600 s/h | 141.4 m³/h |
| 4. Meter turndown | 141.4 ÷ 0.85 (= 5 ÷ 0.03) | ≈ 167:1 |
| 5. Process turndown | Peak 60 m³/h ÷ night minimum 2 m³/h | 30:1 |
| 6. Check velocities | 2 m³/h → 0.071 m/s; 60 m³/h → 2.12 m/s | Both inside 0.03–5 m/s ✓ |
To convert between velocity and flow units for other pipe sizes, use the flow unit converter.
Why does turndown ratio matter when you select a flow meter?
Turndown decides whether one meter can see both the lowest and the highest flow in your process. If the process minimum falls below the meter minimum, the reading drops to zero or becomes unreliable exactly when you need it, for example when you are looking for night-time leakage or a throttled pump.
- Seasonal and day/night swings: chilled-water and cooling-water loops in buildings and data center cooling-water flow monitoring often run far below design flow at part load.
- Pump checks: a pump station flow verification may cover shut-off, partial and full duty in one test.
- Future capacity: a line sized for later expansion runs at low velocity today, so it needs a low minimum velocity.
- Batching and totalising: the start and end of each batch pass through low flow, where a narrow range loses volume.
Does a flow meter keep its accuracy over the whole turndown range?
Not automatically: check how the accuracy is specified. A percentage of reading error shrinks as flow falls, while a percentage of full-scale (FS) error stays the same in absolute terms and grows as a share of the reading. The table compares two hypothetical meters on a 10 m/s span (calculated values).
| Actual velocity | ±1% of reading: error | ±1% FS (10 m/s span): error | ±1% FS as % of reading |
|---|---|---|---|
| 10 m/s | ±0.10 m/s | ±0.10 m/s | ±1% |
| 5 m/s | ±0.05 m/s | ±0.10 m/s | ±2% |
| 1 m/s | ±0.01 m/s | ±0.10 m/s | ±10% |
| 0.5 m/s | ±0.005 m/s | ±0.10 m/s | ±20% |
This is why a turndown figure means little on its own. Ask for the flow range over which the stated accuracy applies, and compare meters on the error they give at your lowest working flow. The same logic for pressure instruments is explained in pressure transmitter accuracy: % FS vs % of reading. What the factory calibration report shows, and how to read the error at each test point, is explained in what calibration certificate comes with a clamp-on ultrasonic flow meter.
What is the turndown ratio of SEGMENsensor clamp-on ultrasonic flow meters?
SEGMENsensor datasheets publish a velocity range and an accuracy for each transit-time model; the turndown column below is calculated from the velocity range. It is not a statement that the stated accuracy applies down to the lowest velocity: send your minimum, normal and maximum flow and we confirm the expected performance per application.
| Model | Pipe size | Published velocity range | Turndown (calculated, per direction) | Published accuracy |
|---|---|---|---|---|
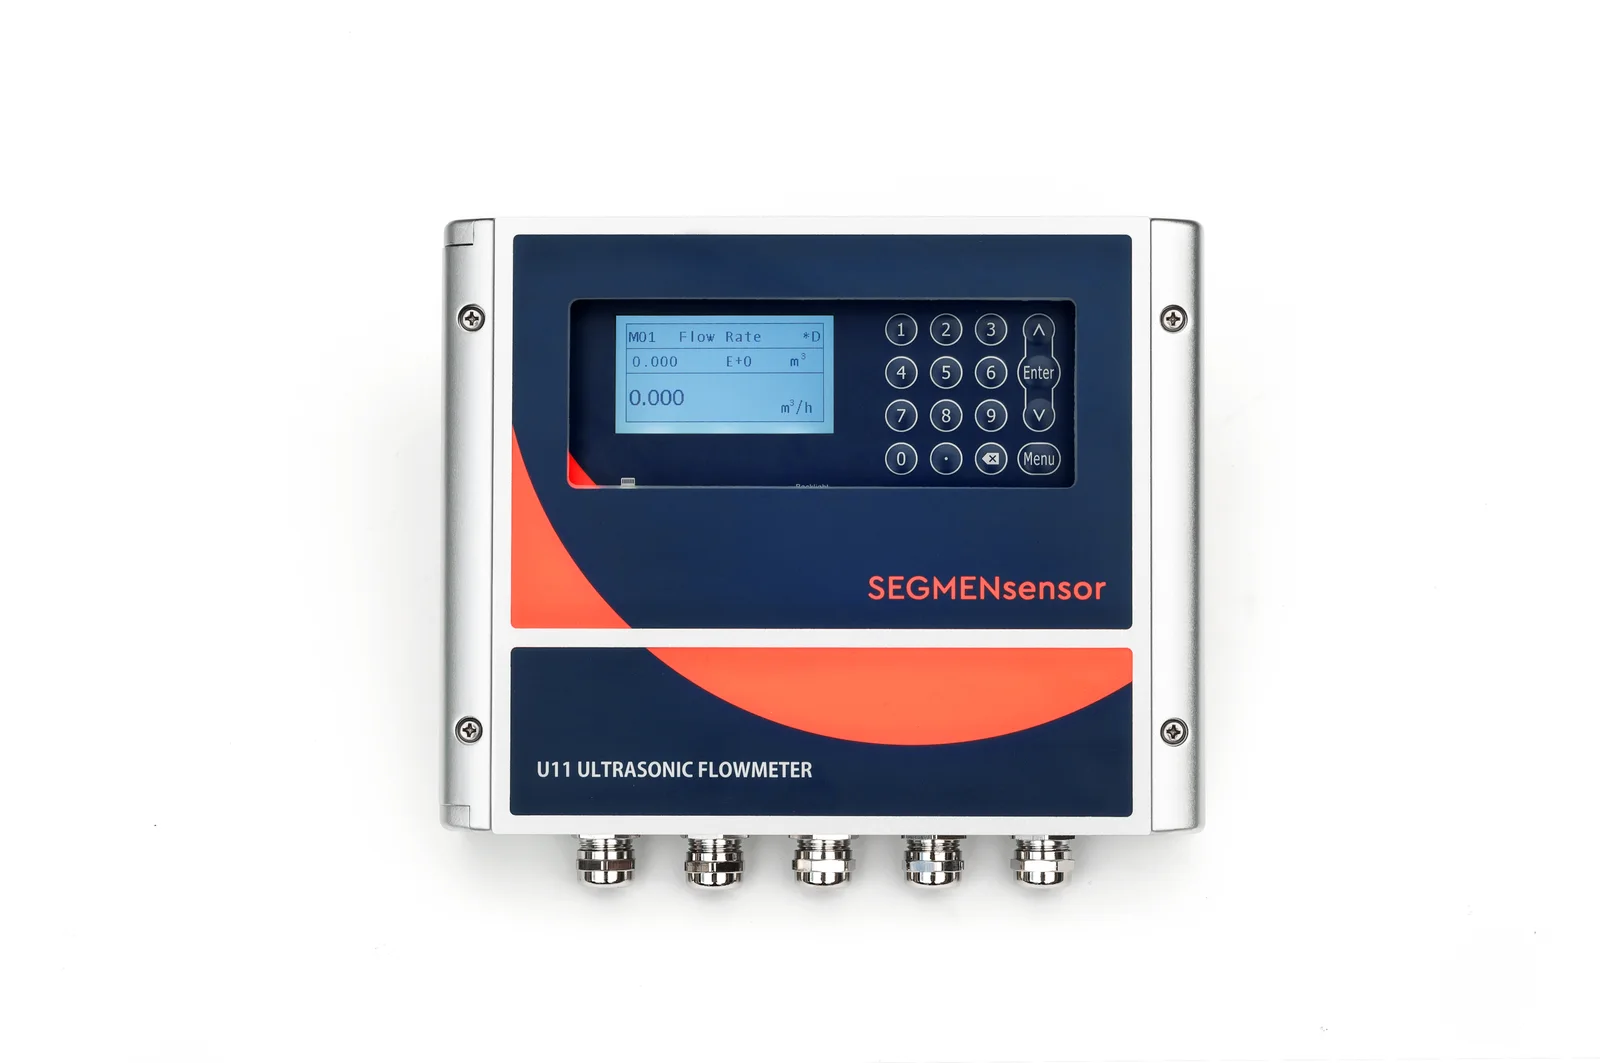
| U11 wall-mount | 15–5000 mm | ±0.01 to ±12 m/s | 1200:1 | ±0.5% (repeatability 0.1%) |
| U20 handheld | 25–1200 mm (1"–48") | ±0.01 to ±12 m/s | 1200:1 | ±1% |
| U10 / U10S PRO wall-mount | 25–1200 mm / 15–1200 mm | ±0.03 to ±5 m/s | ≈ 167:1 | ±1% (repeatability 0.2%) |
| U12 one-piece | DN15–DN65 | 0.03–10 m/s | ≈ 333:1 | ±2% (±1% after calibration) |
| U13 compact one-piece | DN15–DN40 | 0.15–10 m/s | ≈ 67:1 | <3% FS (<1.5% FS after calibration) |
For how these models differ in mounting, display and outputs, see clamp-on ultrasonic flow meter models compared. All of them use the transit-time principle, explained in transit-time vs Doppler ultrasonic flow meters.
Turndown ratio, rangeability, R and span: what is the difference?
| Term | Meaning | Where you see it |
|---|---|---|
| Turndown ratio | Maximum ÷ minimum measurable flow | Flow meter datasheets and sizing |
| Rangeability | Usually the same ratio; some suppliers use it only for the range within stated accuracy | Process instrument specifications |
| R = Q3 ÷ Q1 | Permanent flow rate ÷ minimum flow rate within the maximum permissible error | Water meters to ISO 4064-1 |
| Transmitter turndown | Upper range limit ÷ the smallest span the instrument can be set to | Pressure and DP transmitters |
How do you get the most turndown out of a clamp-on installation?
- Calculate your process turndown first: peak flow ÷ the lowest flow you must see (not zero).
- Convert both flows to velocity on the real inside diameter and check they sit inside the model's velocity range.
- Pick the model with margin: where the lowest velocity is close to 0.03 m/s, a model with a ±0.01 m/s lower limit (U11, U20) leaves more room.
- Give the meter a clean, full pipe: follow the general guidance of 10D straight pipe upstream and 5D downstream, and confirm a signal strength above 60%, as described in how to install a clamp-on flow meter.
- Enter the correct pipe data: outside diameter, wall thickness and material set the area, so an error here shifts every flow reading.
Frequently Asked Questions
A good turndown ratio is one larger than your process turndown. Divide your peak flow by the lowest flow you must measure: a loop that runs from 2 to 60 m³/h needs at least 30:1, and both flows must convert to velocities inside the meter's range on your pipe size.
In most datasheets, yes: both describe maximum flow divided by minimum flow. Some suppliers use rangeability only for the part of the range where the stated accuracy applies, so always check which flow range the accuracy figure refers to.
It depends on the model's velocity range. Calculated from published ranges, SEGMENsensor U11 and U20 (±0.01 to ±12 m/s) give 1200:1 per direction, the U10 series (±0.03 to ±5 m/s) about 167:1, U12 about 333:1 and U13 about 67:1. Expected accuracy at your lowest flow is confirmed per application.
No, the ratio stays the same because it follows the velocity range, but the absolute flows scale with the square of the inside diameter. Doubling the diameter from 100 mm to 200 mm multiplies both the minimum and the maximum flow by four.
No. A range of ±0.01 to ±12 m/s means 0.01–12 m/s in each direction, so the turndown is 1200:1 per direction. The sign only tells you which way the liquid flows.
Send the pipe outside diameter, wall thickness and material, the liquid and its temperature, and the minimum, normal and maximum flow. We reply within 24 hours; qualification samples of 1–5 pcs ship in 5–7 working days, and production lead time and MOQ are confirmed with the quotation.