A pressure transmitter’s accuracy is usually stated as % FS (percent of full scale or span): the error limit is a fixed pressure value, for example ±0.025 bar for ±0.25% FS on 0–10 bar. % of reading (% RD) scales the error with the measured value, so it stays small at low pressure. To compare them, convert % FS into pressure units at your operating point.
What do % FS, % of span and % of reading mean?
All three describe the same thing — the largest error you should expect — but they use a different base value:
| Specification | Base value | Error in pressure units | Typical use |
|---|---|---|---|
| % FS (full scale) | Upper range value (or full span) of the sensor | Constant over the whole range | Most industrial pressure transmitters and transducers |
| % of calibrated span | Span set on the instrument (URV − LRV) | Constant; grows in % when the span is reduced | Re-rangeable transmitters with turndown |
| % of URL | Upper range limit of the sensor cell | Constant, independent of the span you set | Smart transmitters, combined with a turndown rule |
| % of reading (% RD) | The value being measured | Proportional to the reading | Reference gauges, calibrators, some flow and digital instruments |
For a range that starts at zero, full scale and span are the same number. For a compound range such as −1 to +9 bar, the span is 10 bar, so ±0.25% of span is ±0.025 bar. The performance terms used in transmitter data sheets — accuracy, non-linearity, hysteresis, non-repeatability — are defined for process transmitters in IEC 60770-1.
How do you convert % FS to % of reading?
Turn both into pressure units first, then compare at the pressure you actually run at:
| Quantity | Formula |
|---|---|
| Error from % FS | E = (aFS ÷ 100) × FS |
| Error from % of reading | E = (aRD ÷ 100) × P |
| % FS expressed as % of reading | aRD = aFS × FS ÷ P |
| Error on a 4–20 mA signal | EmA = (aFS ÷ 100) × 16 mA |
Here aFS and aRD are the accuracy figures in percent, FS is the full-scale (span) value and P is the measured pressure. The two specifications give the same error only when P = FS.
How large is a % FS error at different points of the range?
The table converts the two SEGMENsensor accuracy classes into pressure and % of reading for a 0–10 bar transmitter.
| Reading (0–10 bar) | % of range | ±0.25% FS = ±0.025 bar, as % of reading | ±0.1% FS = ±0.010 bar, as % of reading |
|---|---|---|---|
| 1 bar | 10% | ±2.5% | ±1.0% |
| 2.5 bar | 25% | ±1.0% | ±0.4% |
| 5 bar | 50% | ±0.5% | ±0.2% |
| 7.5 bar | 75% | ±0.33% | ±0.13% |
| 10 bar | 100% | ±0.25% | ±0.1% |
Worked example: choosing the range for a 6 bar process
- Normal operating pressure is 6 bar. The candidate ranges are 0–10, 0–16 and 0–40 bar, all at ±0.25% FS.
- 0–10 bar: E = 0.0025 × 10 = ±0.025 bar → 0.025 ÷ 6 = ±0.42% of reading.
- 0–16 bar: E = 0.0025 × 16 = ±0.040 bar → ±0.67% of reading.
- 0–40 bar: E = 0.0025 × 40 = ±0.100 bar → ±1.67% of reading.
- The 0–10 bar range gives the smallest error, as long as pressure peaks stay within the transmitter’s overload rating.
Check the 4–20 mA side with our 4–20 mA calculator, and convert bar to psi or kPa with the pressure unit converter.
What does a transmitter accuracy figure include?
On most data sheets the headline accuracy is measured at reference conditions (room temperature, steady supply) and combines non-linearity, hysteresis and non-repeatability. Other effects are listed separately and must be added for the real installation:
- Temperature effect — zero and span shift when ambient or media temperature moves away from the calibration temperature; often given as % FS per 10 K.
- Long-term stability — zero and span drift over time, usually % FS per year.
- Static pressure and mounting effects — mainly for differential transmitters and low ranges.
- Signal chain — the PLC or meter analog input adds its own error to the 4–20 mA signal.
Worked example: total probable error
Independent error sources are commonly combined by root-sum-square (RSS), the method described for uncorrelated components in the BIPM Guide to the Expression of Uncertainty in Measurement (GUM) and NIST Technical Note 1297. Example figures on a 0–10 bar loop:
- Transmitter accuracy ±0.25% FS → ±0.025 bar.
- PLC analog input, assumed ±0.1% of span for this example → ±0.010 bar.
- RSS: √(0.025² + 0.010²) = √0.000725 ≈ ±0.027 bar.
- Worst case (straight sum): 0.025 + 0.010 = ±0.035 bar.
Add the temperature effect and stability terms from the data sheet in the same way when the installation runs far from room temperature or between long calibration intervals.
% FS vs % of reading: which is better?
| Criterion | % FS specification | % of reading specification |
|---|---|---|
| Error near zero | Same absolute error as at full scale | Approaches zero (often with a floor) |
| Error at full scale | Equal | Equal |
| Easy to compare between sensors | Yes, after converting to pressure units | Yes, but check for an added “+ % FS” term |
| Best fit | Processes that run in the upper half of the range | Wide-ranging pressures where low values matter |
| How to get the most from it | Size the range so the normal value sits high in the span | Confirm the minimum pressure the % RD figure applies to |
Neither is better in itself. A % of reading figure looks smaller but often comes with a low-end limit or an added % FS term, written for example as “±(x% RD + y% FS)”. Always convert both to pressure units at your real operating point.
Need a transmitter sized for your operating point?
Send us the normal and maximum pressure, medium, temperature and output signal. We will suggest the range and accuracy class. MOQ 1 pc · samples in 5–7 working days · production 3–5 weeks · reply within 24 hours.
What accuracy do SEGMENsensor pressure transmitters offer?
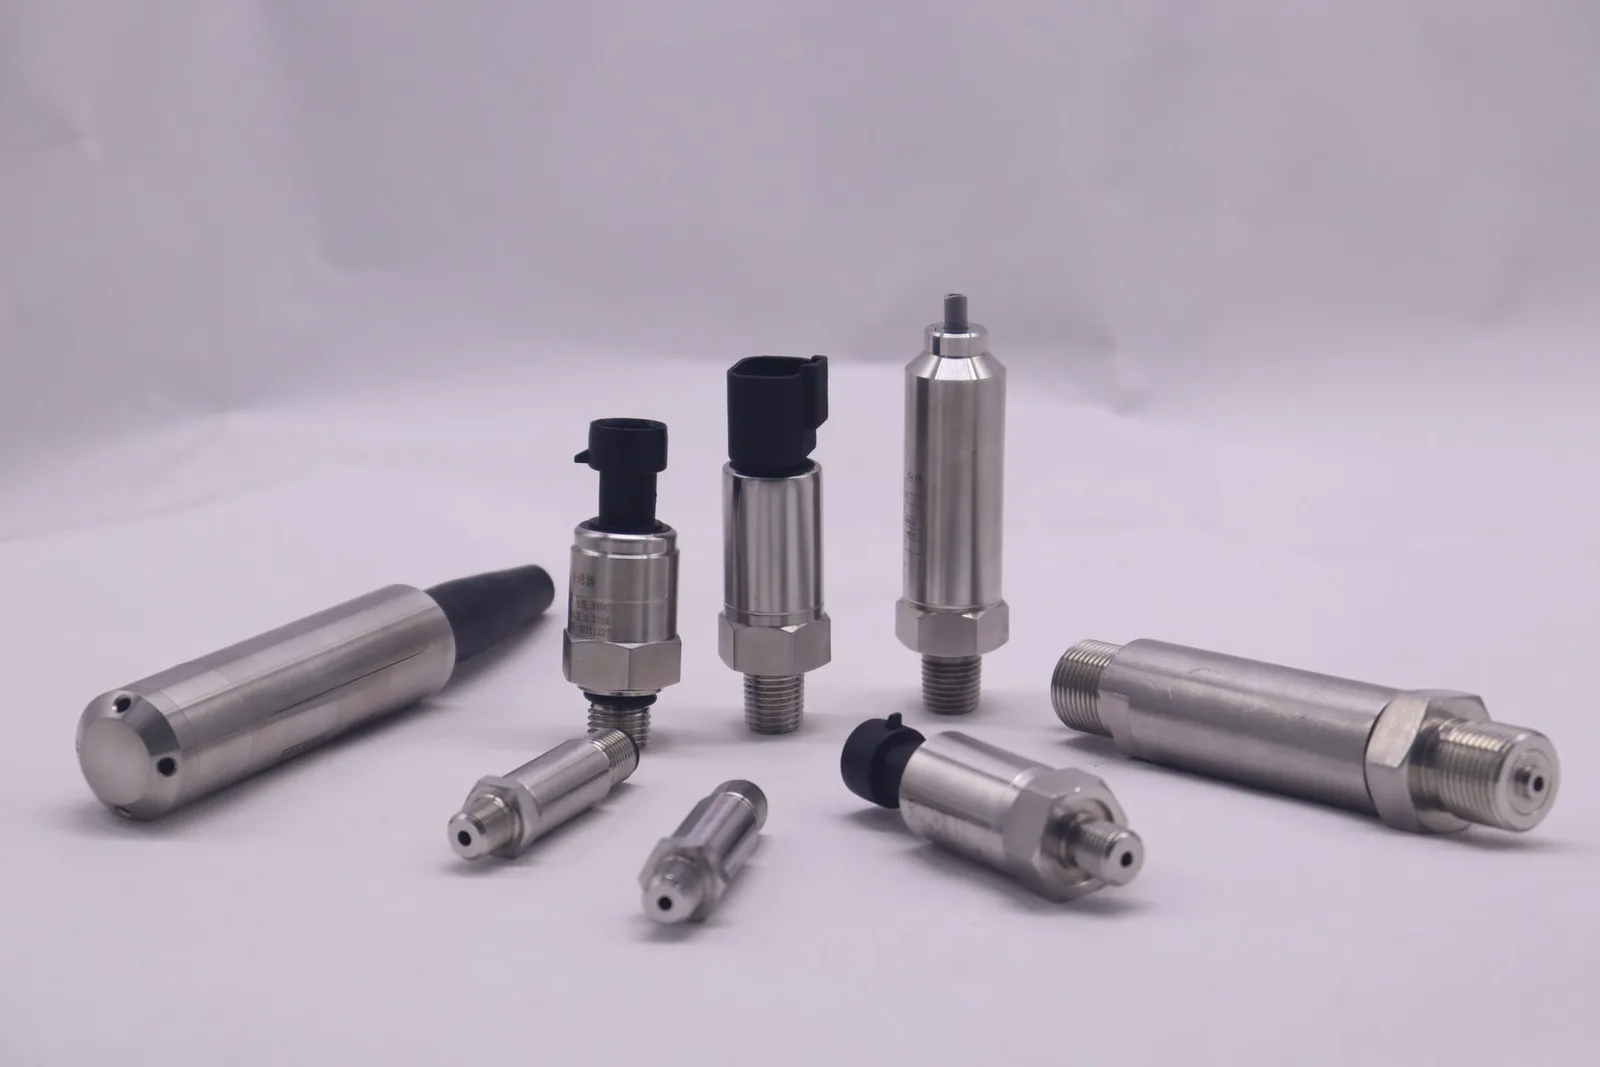
SEGMENsensor pressure transmitters are specified in % FS: ±0.25% FS as standard and ±0.1% FS on the high-accuracy version, over ranges from 0–0.1 bar to 0–400 bar in gauge, absolute and differential configurations, with 4-20 mA 2-wire, 0-10 V or RS485 output. For range and signal selection read the 4-20 mA pressure transmitter selection guide; for pressure references see Gauge vs Absolute vs Sealed Gauge Pressure; for output types see Pressure Transducer vs Pressure Transmitter. Hydrostatic level users can use the submersible level transmitters and the hydrostatic level calculator.
Frequently Asked Questions
It means the error can be up to 0.25% of the full-scale value anywhere in the range. On a 0–10 bar transmitter that is ±0.025 bar at 1 bar, at 5 bar and at 10 bar alike. On a 4–20 mA output it equals ±0.04 mA.
Only below full scale. At full scale ±0.25% of reading and ±0.25% FS give the same error. Below it, the % of reading error is smaller — at 25% of range it is one quarter of the % FS error. Check whether the % of reading figure has a low-end limit or an added % FS term.
Multiply the % FS figure by full scale divided by the reading: % of reading = % FS × FS ÷ P. For ±0.25% FS on 0–10 bar at 2.5 bar: 0.25 × 10 ÷ 2.5 = ±1.0% of reading.
Usually not. The headline accuracy normally covers non-linearity, hysteresis and non-repeatability at reference conditions. Temperature effect and long-term stability are listed separately on the data sheet and are added, often by root-sum-square, to estimate the total error in the field.
Because a % FS error is fixed in pressure units, it is a smaller share of a higher reading. At 6 bar a 0–10 bar range at ±0.25% FS gives ±0.42% of reading, while a 0–40 bar range gives ±1.67%. Leave enough margin for pressure peaks and the overload rating.
SEGMENsensor pressure transmitters are ±0.25% FS as standard or ±0.1% FS high-accuracy, from 0–0.1 bar to 0–400 bar. MOQ is 1 piece, samples ship in 5–7 working days, production takes 3–5 weeks and quotations are FOB China, with a reply within 24 hours.